By Sarah Hewitt
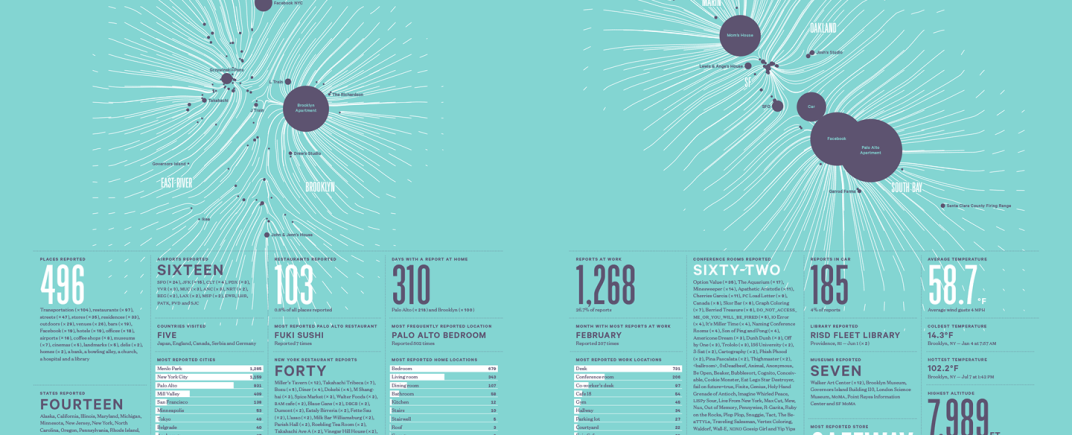
I was having dinner with an illustrator friend last night and we started discussing Nicholas Felton’s ‘Annual Reports’. These are a series of beautifully produced infographics detailing the past year of his life in various elements such as coffees consumed in different cities and weddings attended. Each year has a loose theme, such as distance or time, but all represent that vast amount of data Felton collected over the course of the year.
Data is big business these days, and the concept of ‘big data’ is becoming even bigger – we are all aware how much information about our lives is recorded and stored, from basic identity facts to the brand of cereal we buy at our preferred supermarket every Wednesday. With the explosion of smartphones and apps helping us to keep track of everything from our receipts, our movement and our activities, Felton’s job of recording his life can be seen as a relatively straightforward process.
But what happens throughout the year while he is recording his data? On his website, he is asked about whether tracking elements such as the time spent running or in the gym encourages him to change his behaviour.
“The project has always been structured to record my natural behaviors, rather than influence them, which is why I refrain from tallying the results until the end of the year. Of course…if you can see the miles you walk daily starting to fall, then there’s an impetus to walk more.”
Felton’s approach can be applied to the array of apps that track your calorie consumption and exercise habits, which are designed on the principle that the more you monitor something, the more aware you are when your behaviour start to change, and then you have the option of altering it accordingly.
So how can this process of tracking, recording and monitoring aspects of our lives be applied to understanding the built environment? Well, several organisations are already out there, recording peoples’ behaviour in relation to place – The Mappiness project for one springs to mind. The US design company Sasaki is another: they have recently produced a report called ‘The State of the City Experience’, where a whole range of aspects of urban living that are often not considered in research projects were explored. These two projects, to name just a few, show that there is a wealth of potential out there to use new technology, and a different approach to data collection, to unlock user experiences of the built environment. We could track how people move about a city in order to inform transport plans and encourage more sustainable transport behaviour, we could discover the real under-utilised spaces of a town in order to identify areas ripe for regeneration, or we could even take a more ethnographic and phenomenological approach and simply understand the lived experience of those living in a specific place. Using data in this way, we can put the people at the heart of the projects, which is, after all, what environmental psychology is all about.
For older posts, click here.
Photo Credit: Nicholas Felton, available at www.feltron.com.

